What are you looking for?

Aleksei Gorodenkov - alamy.de

A logistics simulation was carried out to determine the performance of the traffic system on the Frankfurt Bridges

The simulation of autonomously driving vehicles in the Frankfurt Bridge route network shows that 400 vehicles can transport around 40 million passengers per year with the help of the centrally controlled system. At the same time, most bridge routes are at least as fast as public transportation, often even faster. Above all, however, it is more convenient to travel from a bridge arm in the north across the ring to a bridge arm in the south (or from west to east) and neither have to change trains nor - especially at night or in the dark - have to descend into subway or commuter train shafts. Also taken into account in the simulation was the traffic of commercial vehicles (for multi-use system disposal, green maintenance, etc.).

Basics and ACTUAL situation in Frankfurt am Main

Persons transported by public transport in the Rhine-Main region

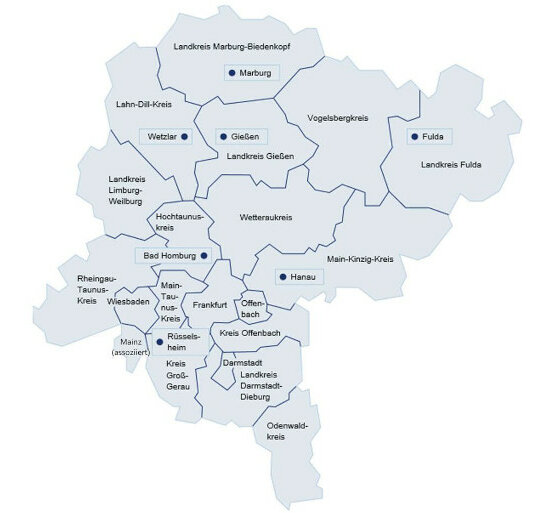
The initial situation in the city of Frankfurt am Main: The framework is provided by the passenger volume in the RMV area (route area of the Rhine-Main Transport Association), which extends from Darmstadt in the south via Frankfurt, Offenbach and Hanau to Marburg, Wetzlar and Giessen in the north and Fulda in the northwest. Around 788 million passengers were transported there in 2018.

rmv.de

Persons transported by public transport in Frankfurt

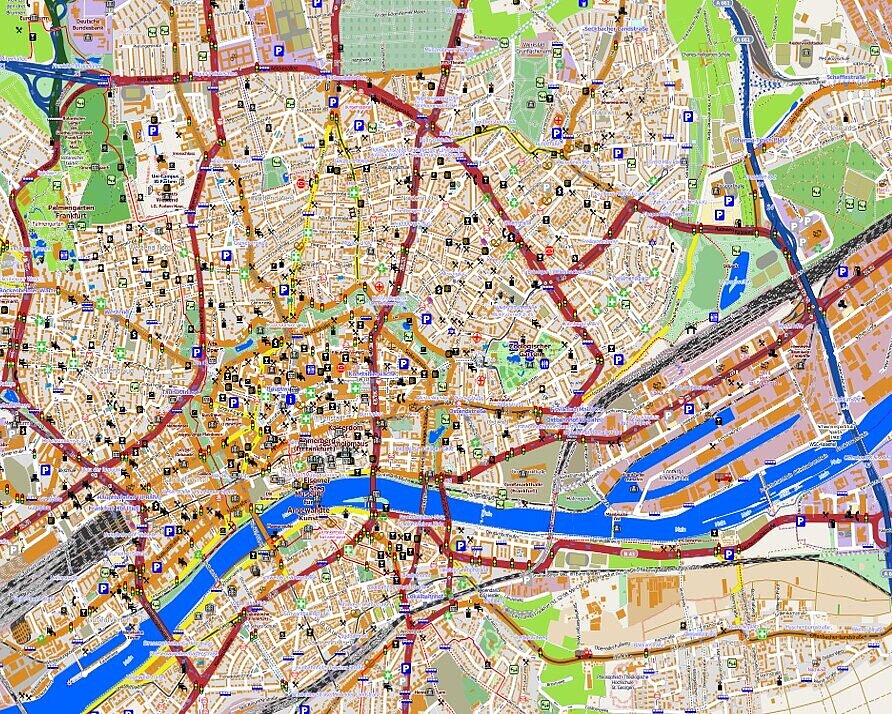
The passenger volume specifically in the city of Frankfurt am Main: In 2019, Verkehrsgesellschaft Frankfurt am Main mbH (VGF) transported about 144 million passengers by subway and about 67 million people by streetcar. In addition, In-der-City-Bus GmbH (ICB) transports more than 31 million passengers per year by bus through Hesse's largest city. In total, therefore, around 242 million passengers are transported within the city each year.

mappedplanet.com

Persons transported by bridge means of transport

The overall system of Frankfurt bridges (BrückenNahVerkehr = BNV) can transport at least 70,000 people daily or at least 25 million passengers annually with its 200 trains and buses. Another 200 smaller vehicles can transport at least another 10 million passengers per year. With a passenger transport of at least 35 million passengers, the bridge traffic represents a significant relief for Frankfurt's road traffic.

Stiftung Altes Neuland Frankfurt / GNU

Over 400 trips per day were included in the simulation for the special vehicles - most of which are delivery trips

Police, fire and rescue service trips

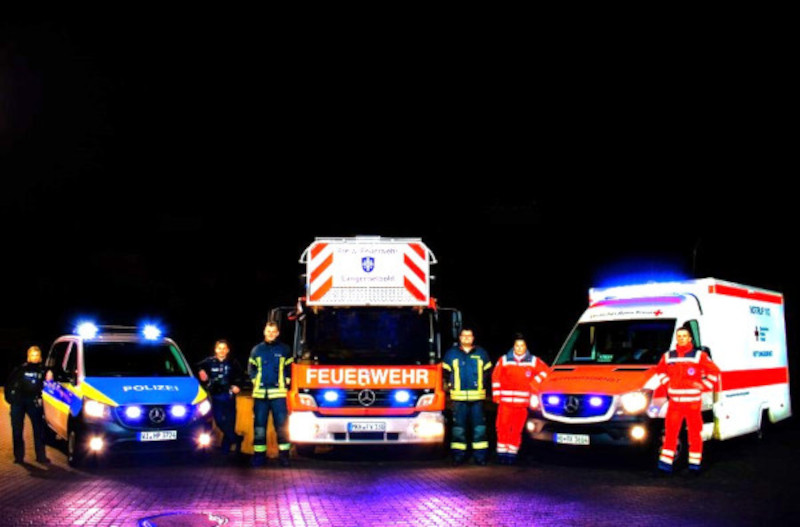
In order to determine the number of trips made by the special vehicles that are attributable to the police and fire and rescue services, the statistics of the Frankfurt police headquarters with 114,421 calls per year and the data of the Frankfurt fire department with a total of 110,975 calls for fire and rescue services per year were used. These 225,000 calls served 763,380 residents of Frankfurt. Accordingly, for the 35,000 bridge residents, a maximum of 10,000 call-outs per year for police, fire and rescue services can be expected.

twitter.comfflgs_Langenselbold

Trips for delivery traffic and mail

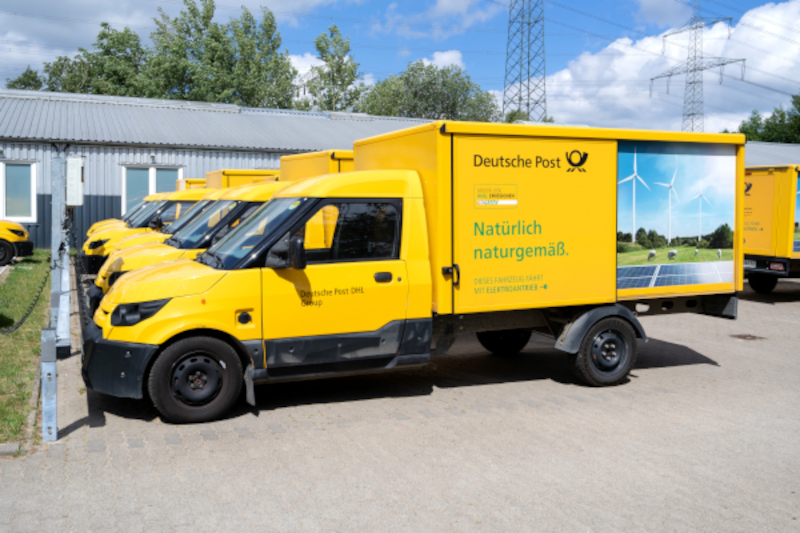
The same calculation system was used to determine annual parcel shipments. Throughout Germany, 3,650,000,000 CEP shipments (courier, express and parcel service shipments) are sent, which corresponds to about 45 deliveries per person per year. In addition, the delivery traffic for the businesses and stores on the bridges is taken into account with 1-2 deliveries per day for fresh products, whereby it was also included in the simulation that not every delivery comes from the same provider/supplier.

Bjoern Wylezich - shutterstock.com

Trips to waste recycling

Normal residual waste is disposed of on the bridges by a pipeline system. Packaging waste hardly arises, as the purchases on the bridges themselves are collected separately in "renomats" with reusable packaging or PE packaging. For these, however, vehicles have to come to collect them, and more voluminous items such as green waste in particular (twigs, cut grass, etc.) also have to be taken away. Renomat collection is done at night with a total of approximately 15,000 collection trips per year. Green space waste and other hazardous waste was estimated at 5,000 trips p.a.

Stiftung Altes Neuland Frankfurt GNU

Basics and actual situation of hydrogen buses and trains in the BNV

Service life of H2 buses in the BNV

The number of H2 vehicles required was derived from existing transport systems with H2 buses. There, hydrogen buses have an availability of 0.6 with a daily service time of 8-16 hours and a 7-day per week operation. Therefore, the bridge vehicle requirement must be multiplied by at least 1.66 to get the real required amount of vehicles. With wider deployment of hydrogen technology, H2 vehicle fleet availability can be expected to increase to 0.85.

businessinsider.de

Downtime due to refueling and trips to service stations

In addition, all trips to refueling stations and the refueling time must also be taken into account. The bridge streetcars (i.e. vehicles with a train look) and buses are smaller than conventional H2 buses used in public transport. They are also significantly lighter in construction. The refueling time for vehicles of this size and weight is on average 10 minutes, so that about 2 refueling stops per vehicle per day are necessary.

kaernten.orf.at

Maintenance of a new technology

Hydrogen buses have a lower availability than buses with combustion engines. The biggest driver here is the maintenance interval, which is only 7 days for local passenger transport vehicles. With increasing use, further development and years of experience, it can be assumed that this maintenance interval can be reduced to the level of vehicles with internal combustion engines.

igt-gmbh.eu

A logistics simulation was carried out to determine the performance of the transport system

The logistics simulation was used to determine the performance and maximum overall capacity of the transportation system.


In addition, based on the simulation results, an optimization of intersections, stations and route sections was carried out so that congestion and long waiting times can be avoided.


However, in the present simulation it was assumed extremely conservatively that the 200 larger vehicles stop at all stations. However, this is the absolute worst-case scenario, because the vehicles de facto only stop on demand at stations to which they come "on demand," i.e., when someone requests a vehicle there by pressing a button or has signaled their destination and location in advance by clicking on the bridge app.

Stiftung Altes Neuland Frankfurt / GNU

300 vehicles transport people on the bridges over XY km through Frankfurt

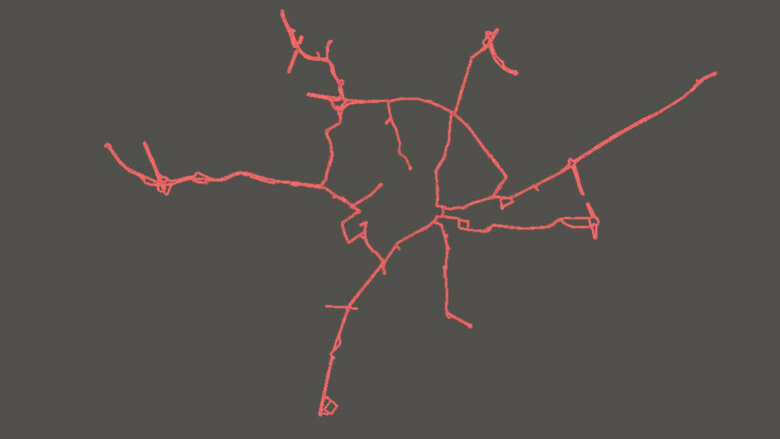
The total route has a length of 60 kilometres, on which more than XY buses, cars and special vehicles transport passengers through Frankfurt around the clock. Table XY shows the number of vehicles available in the respective vehicle class.

Buses serve demand-driven, depending on the passenger demand in the bridge app, the stations on the route. Cars are used for private special trips and can also drive directly to entrances or parking lots of buildings - and therefore do not only stop at stations. In the category special vehicles are all vehicles that are necessary for everyday life on the bridges, such as garbage collection, fire department, police and post office.

Stiftung Altes Neuland Frankfurt / GNU

A logistics simulation was used to determine the performance and the maximum overall capacity of the traffic system. Furthermore, based on the simulation results, an optimization of intersections, stations and route sections can be carried out so that congestion and long waiting times can be avoided.

An average of around 40 million passengers per year can be transported on the Frankfurt bridges route network with a fleet of 400 vehicles to cover demand

The entire system with 266 stations, at which an average of 4 people get on or off (number of passenger changes), can thus transport at least up to 68,814 people to their desired destination every day. This is roughly equivalent to the population of the city of Fulda. If we assume a higher number of passenger changes of 6 or 7 people getting on or off the train, the number of people transported increases to around 100,000 to 120,000 per day. Calculated over the year, this means: 25 million people per year are transported on the Frankfurt bridges in the worst case scenario, but between 37 million and 44 million p.a. under normal conditions.

Half of the vehicle fleet consists of vehicles that can transport up to 25 passengers. In the best case, this means that at a station with a 90-second interval, up to 1,000 passengers are transported within an hour.

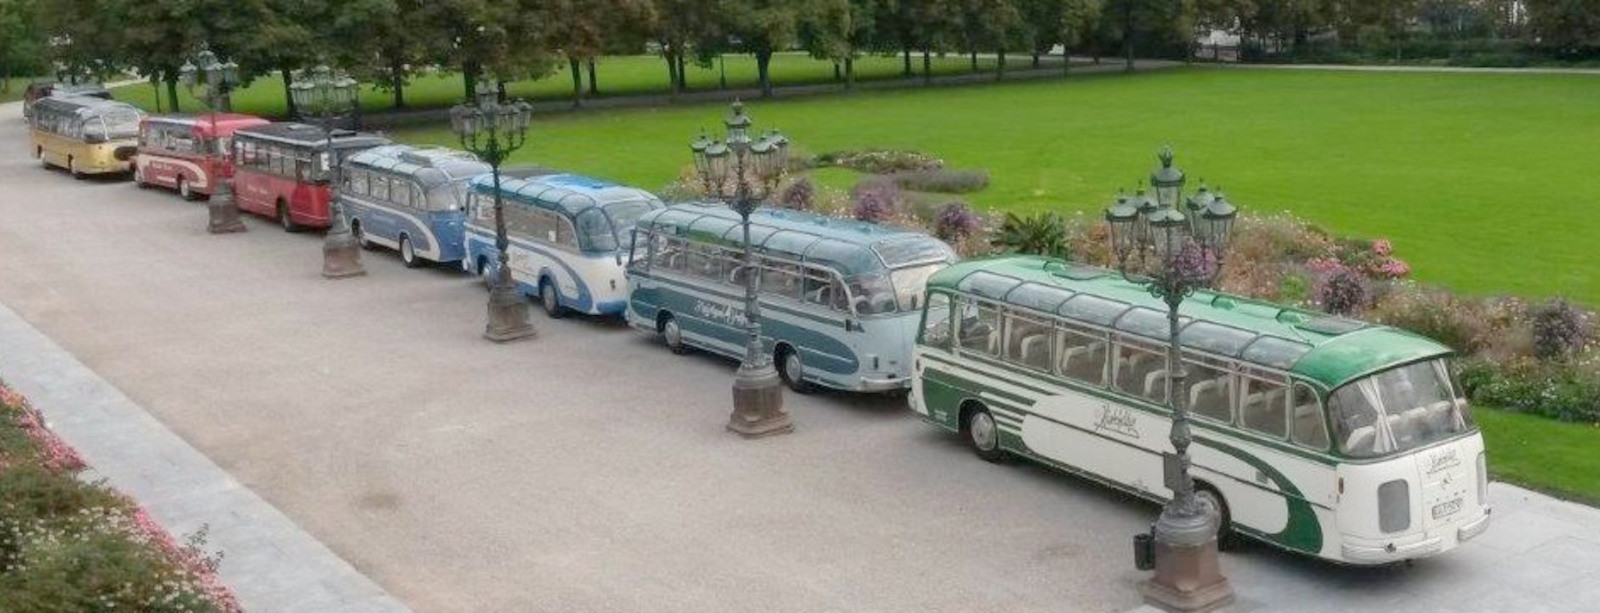
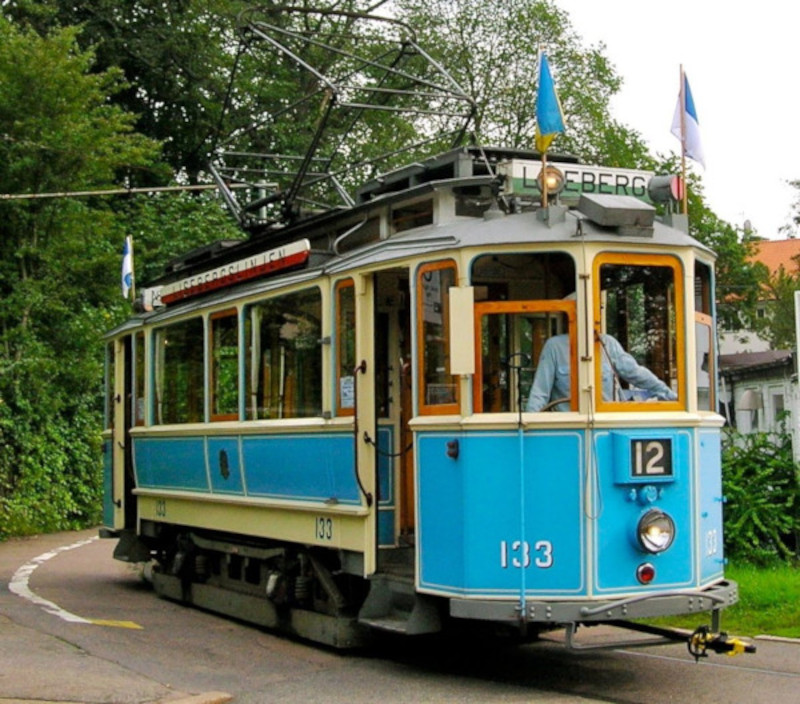
The illustrations below on the right show an example of the largest vehicle, a bus, which offers space for 16 seated passengers and provides for up to 10 standing passengers (the driver's seat including the steering wheel is not intended to control the autonomously driving vehicle, but results from the model of the vintage car replicas and is, for example, a particularly exciting seat for children).

Stiftung Altes Neuland Frankfurt / GNU

Performance promise instead of timetable: A short waiting time of 90 seconds enables fast routes to the desired destination

If the demand for buses is particularly high in one area of the route, stations there can be approached with a cycle time of up to 90 s, thus reducing waiting times for passengers to an absolute minimum. This is achieved by the demand-oriented on-demand system, the high number of vehicles available at any time, and route optimization by simulating extreme cases.

Vehicles that are not needed are cleaned and refuelled at the maintenance loops at the ends of the bridge arms, ready for a new deployment at any time.

oldtimervermietung-events.de

Procedure for route modeling and model building for simulation

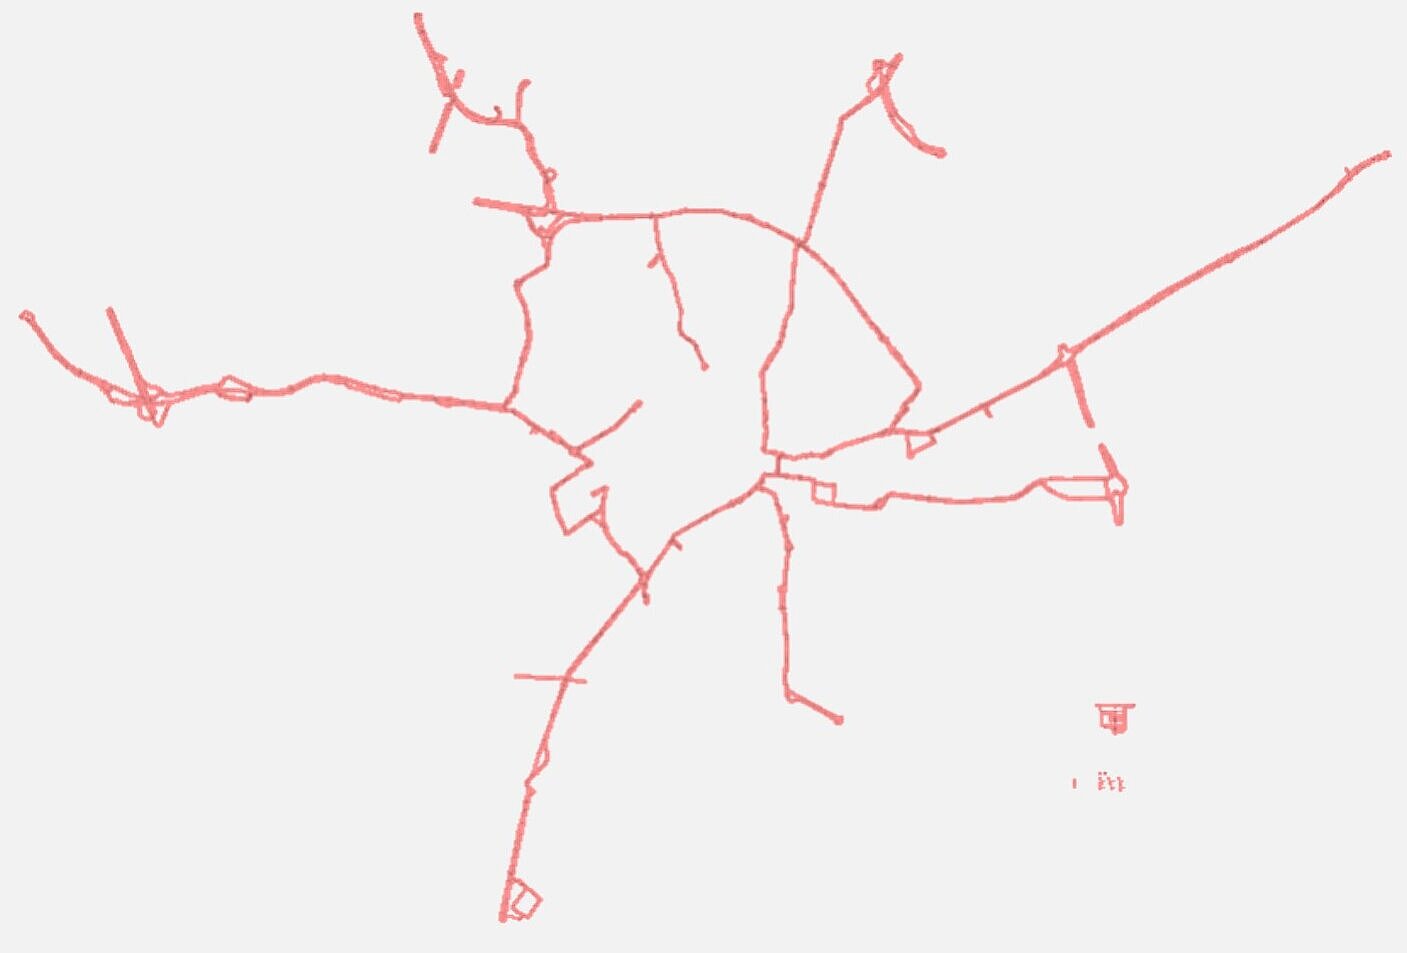
Modeling of the route on city maps

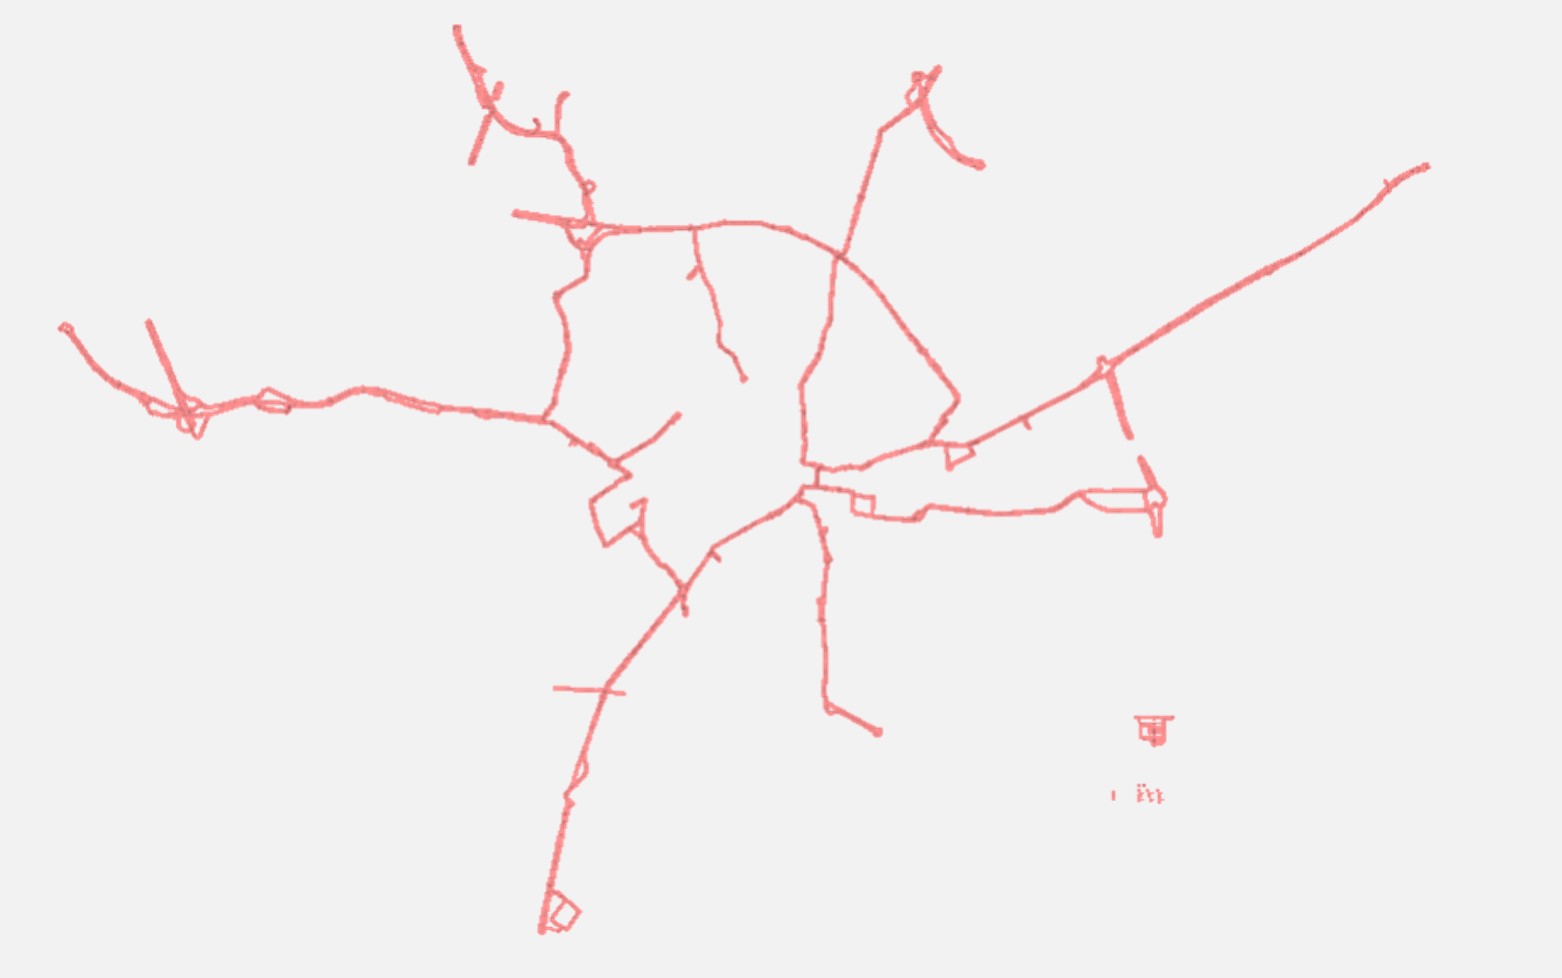
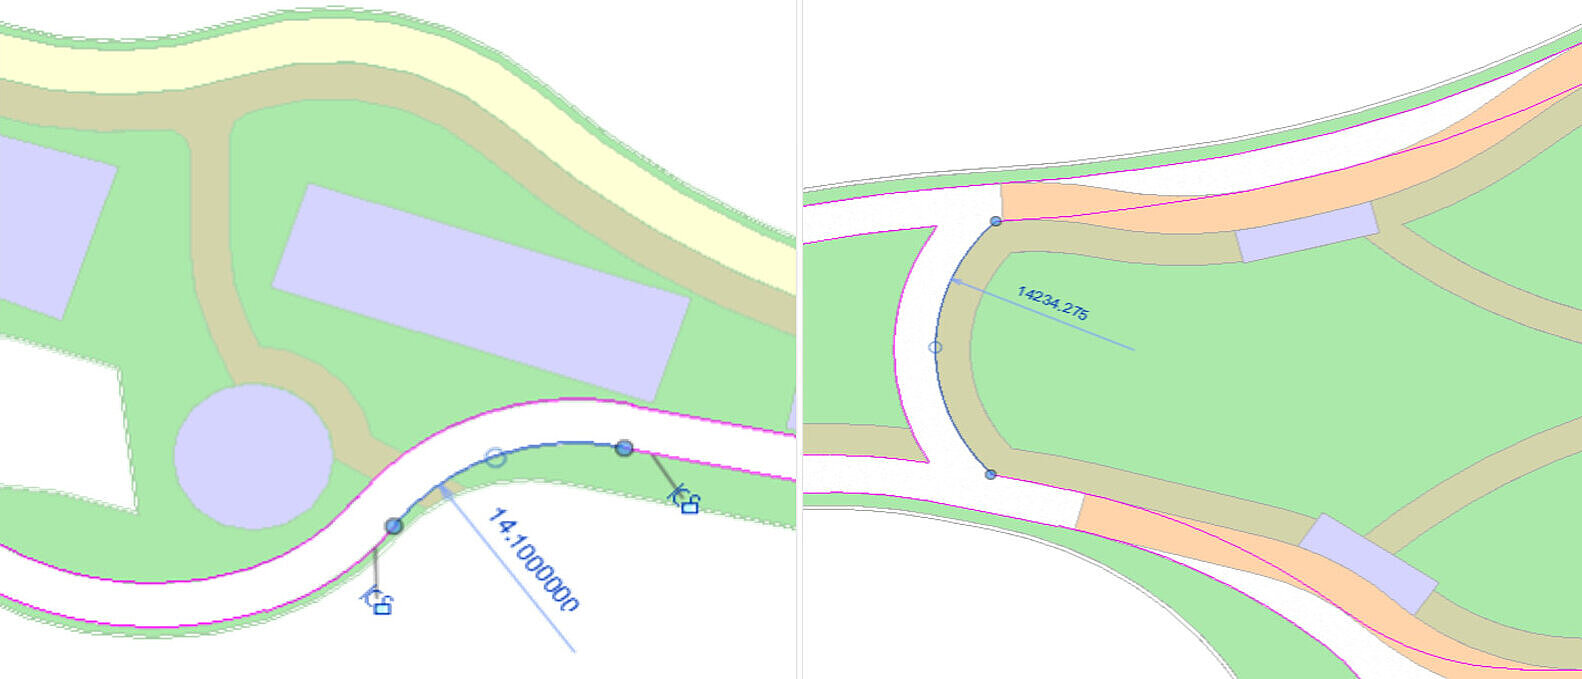
To achieve the highest accuracy in the simulation, the route is modeled on city maps at a scale where one pixel corresponds to 0.169 meters. The route defines the direction of travel of the vehicles (opposite lane structurally separated) and specifies the route network on which the vehicles can move.

Stiftung Altes Neuland Frankfurt GNU

Modeling of the vehicles and stations

Vehicles are represented in the simulation as objects with defined length, acceleration, speed and many other parameters. Stations are represented as stop lines with a fixed position and a defined stopping time of the vehicles (which can also be specified statistically distributed).

Stiftung Altes Neuland Frankfurt / GNU

Creation of the algorithm for controlling the Driving distance of the vehicles

The movement of the vehicles on the route network specified by the bridges is determined in the simulation by an algorithm that specifies parameters such as speed, acceleration, route to be traveled, stations approached, and the stopping time at stations. 

Stiftung Altes Neuland Frankfurt GNU

A large station network is being created on the Frankfurt bridges with numerous entry and exit points in Frankfurt

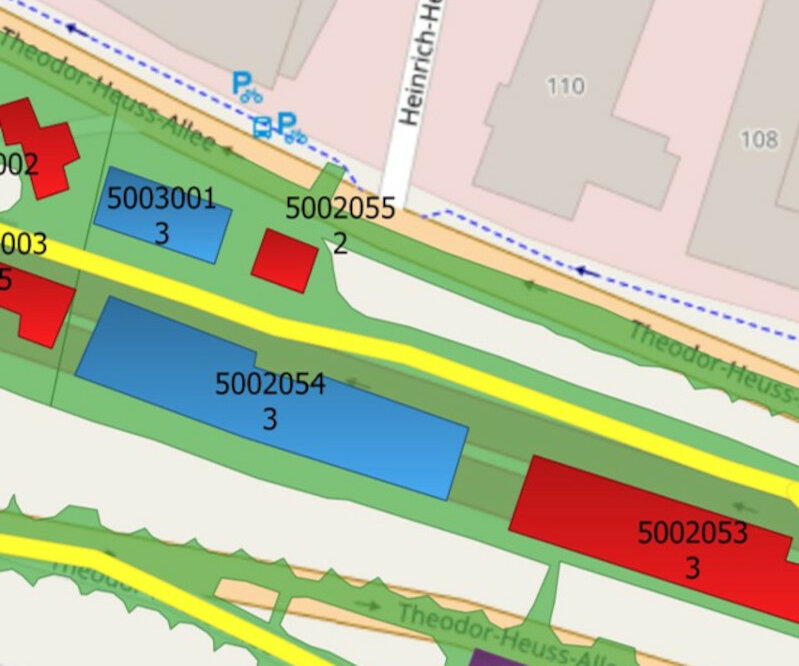
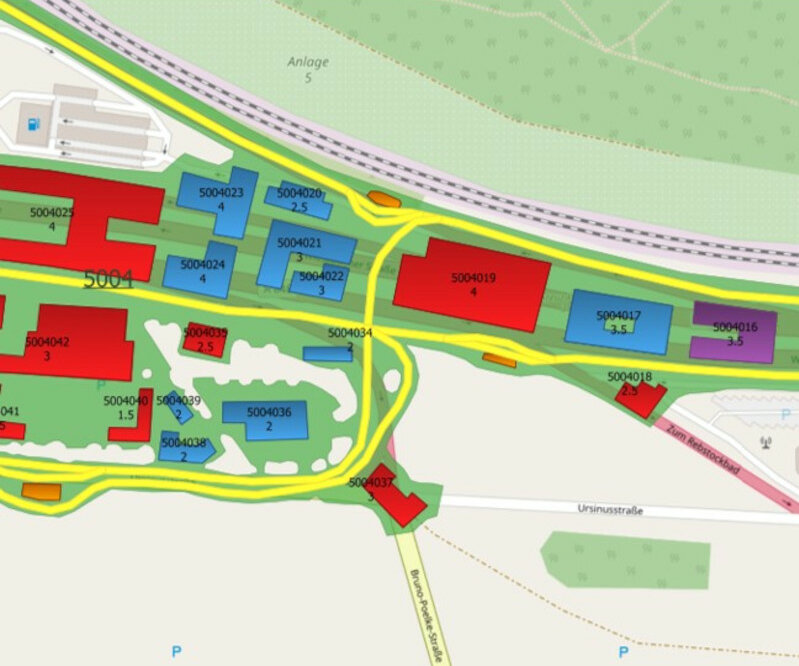
There are over 266 stations and 613 parking slots along the entire route. One station serves as a stop for the vehicles and at the same time as an alternative lane so as not to obstruct passing special vehicles such as the police, emergency medical services and fire department. In addition, they serve as a staging area for waiting passengers and enable barrier-free boarding and alighting. Parking niches, on the other hand, are used exclusively for parking cars and minibuses or for getting on or off at the destination.

Stiftung Altes Neuland Frankfurt / GNU

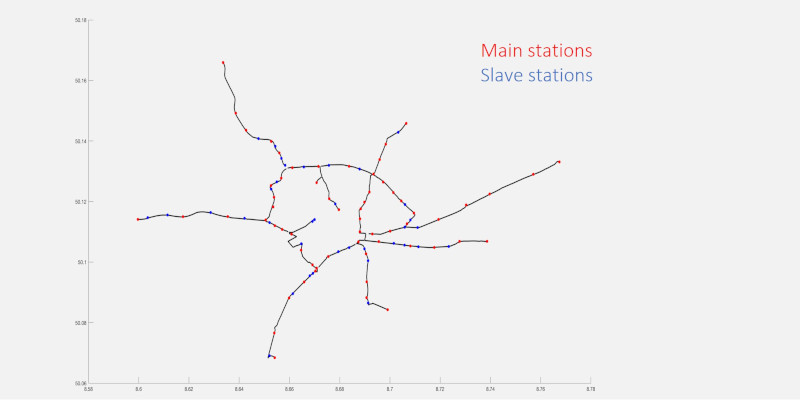
The transport network of the Frankfurt bridges is divided into heavily frequented main stations and less frequented secondary stations

In the demand-responsive transit system, areas and stations with many trip requests are served much more frequently.

This results in main stations with very high demand, where approx. every 90 seconds, because the central system is informed (usually by cameras) about the high passenger volume; secondary stations, on the other hand, have a lower number of trip requests, which are usually also reported more frequently to the central control system via the bridge app and less frequently via cameras (anyone approaching a secondary station is more likely to enter their destination in advance via their bridge app, because they cannot assume that others are already waiting there and have "activated" the camera - at main stations, on the other hand, people tend to rely on the fact that vehicles are coming all the time anyway). This results in an average waiting time of 5 minutes until the next vehicle arrives at the secondary stations. The overview map in the figure shows this distribution with main stations in red and secondary stations in blue.

The main stations on the Frankfurt bridges are served by almost all vehicles.

Thus, the waiting time at these points is particularly short and, in the best case, is even only 50 seconds.

 Main stations are often part of express routes, where only selected main stations are served to cover long distances quickly.

Stiftung Altes Neuland Frankfurt GNU

General transport strategy on the Frankfurt bridges

Circulating vehicles ensure supply to the stations within 50 seconds in the best-case scenario

In order to provide vehicles around the clock after only 50 seconds at stations in the best case, vehicles stop in all route sections to serve short-term demand. In other words, some vehicles circle in sections (especially on the ring road) without stopping at stations.

Victor Donovan

Private trips by car and minibus are carried out on demand - and all accessible vehicles always have priority in the overall system anyway

Thanks to the even distribution of parking bays across the route network, pickup is very fast even for last-minute requests. Accessible cars and "minibuses" always have priority over all other vehicles: they arrive the fastest.

motor1.com

Special vehicles only drive when required or on missions

Statistics from the city of Frankfurt and other major German cities were used to determine how many police, fire department, refuse collection and post office trips there are likely to be on the bridges on average. This was taken into account in the simulation as so-called "background noise", i.e. randomly circling vehicles. Emergency scenarios with absolute right-of-way for emergency vehicles have not yet been simulated as part of this feasibility study. A sufficient number of passing bays, on the other hand, was planned into the route.

makezine.com

The logistics simulation was carried out with certain boundary conditions and input parameters

The logistics simulation was carried out with certain boundary conditions and input parameters

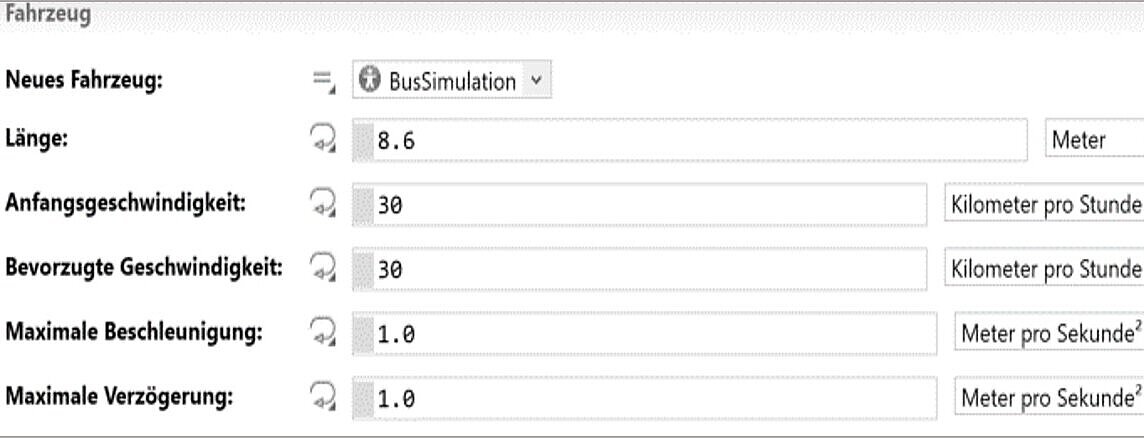
Vehicles were parameterized in the simulation as follows:

-Initial speed: 30 km/h

-Maximum speed: 30 km/h

-Positive acceleration: 1.0 m/s2

-Negative acceleration: 1.0 m/s2

-

Stiftung Altes Neuland Frankfurt / GNU

Parameterization of the route

The route is parameterized as follows:

-The design of the curve radii was chosen in such a way that all sections can be driven at 30 km/h. 

-No speed limits (maximum speed is limited to 30 km/h by the design of the autonomous vehicles).

-Turning vehicles allow passing vehicles to pass and turn only without obstructing following vehicles.

Stiftung Altes Neuland Frankfurt / GNU

For the simulation of stations and stops, among other things, empirical values from public transport were parameterized

Stations are two-lane sections of track that have a stop line at a defined position where vehicles can stop to change passengers.


Vehicles that do not need to stop at the station can pass without obstruction in the second lane.


When entering stops, the vehicles decelerate to a standstill with the parameterized acceleration.


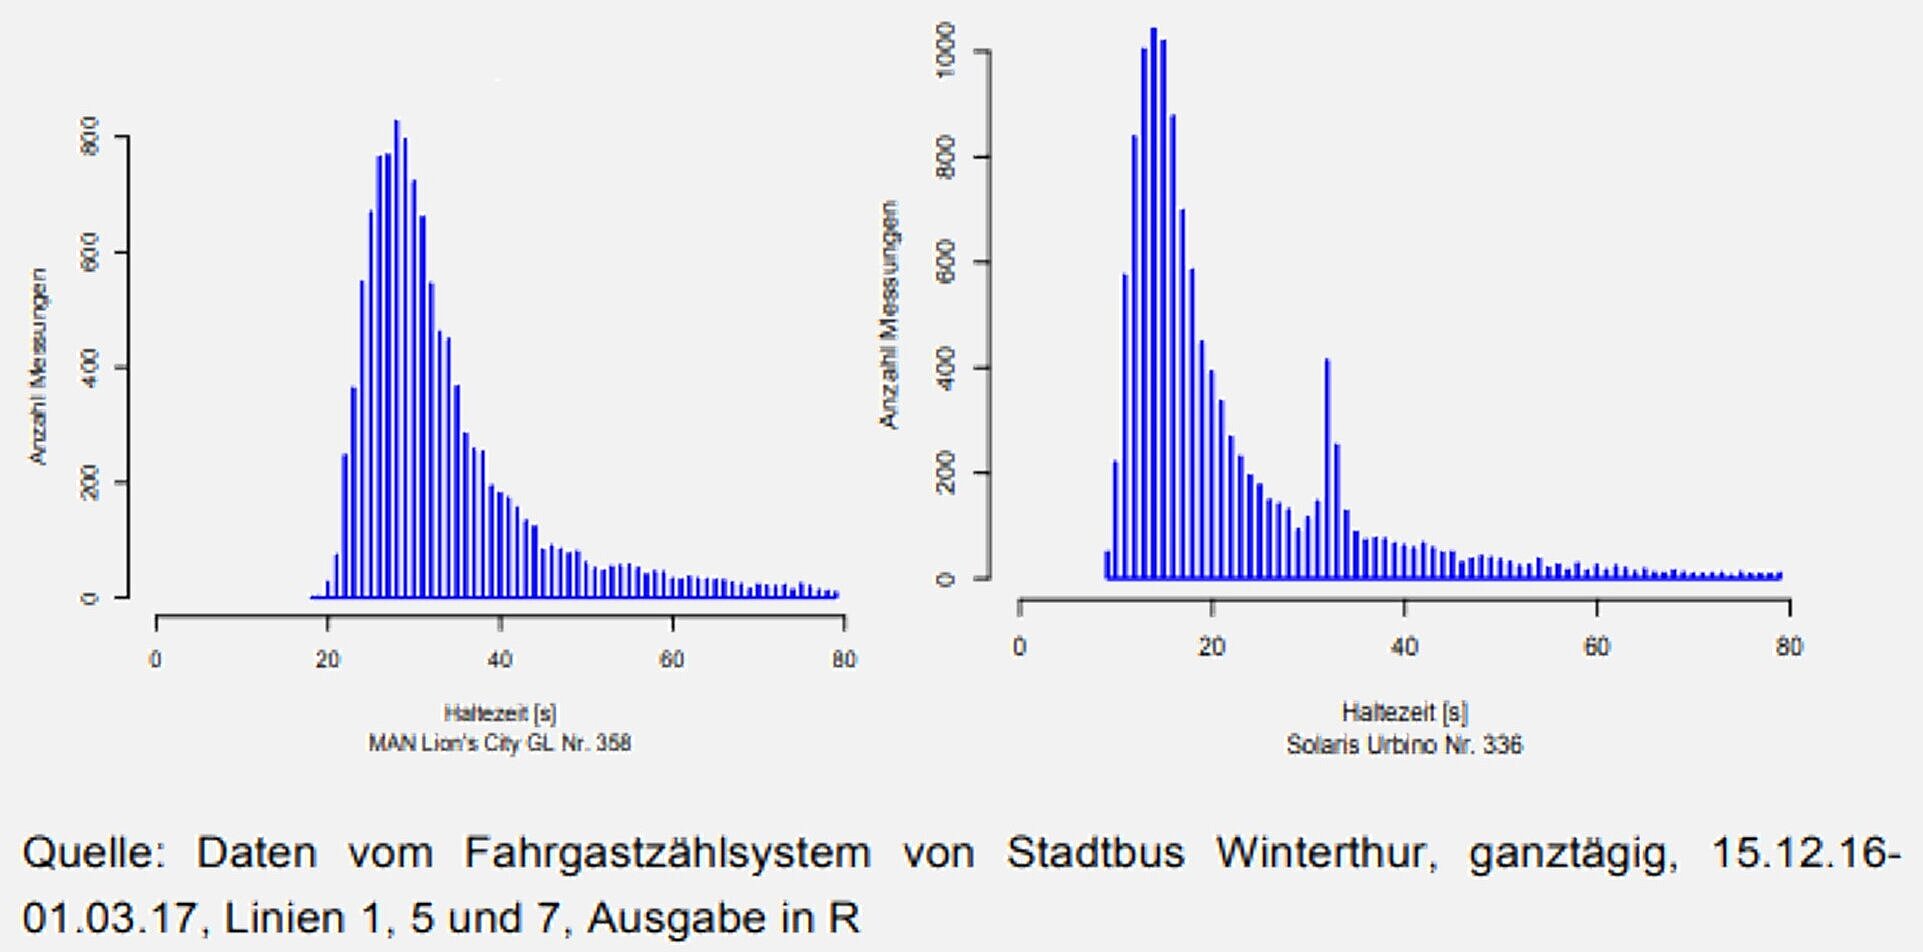
 The vehicles then stand at the line for 30 seconds to allow passengers to board and alight. This value was determined empirically using a public transport system in a major Swiss city and used for the overall simulation.


Finally, the vehicles accelerate again with the parameterized value and rejoin the main line while observing the right-of-way rule.

Stiftung Altes Neuland Frankfurt / GNU

Reference research on average station stopping times in public transport

To define the input data and parameters into the logistics simulation, it is therefore necessary to use reliable data from the existing data of the public transport bus systems of major European cities.

The aim is to define the average duration of a stop at a station from the available data. This is made up of door opening and closing time, passenger changing time and the time until the vehicle restarts. This means that the complete period of time during which the vehicle is stationary is taken into account.

Stiftung Altes Neuland Frankfurt GNU

Additional information for the calculation of the average holding time

The histogram shows an all-day evaluation of a passenger counting system of the European city of Winterthur (CH). It becomes clear that a stop time of 80 seconds represents the worst case, since the majority -with over 75% of all stops- is shorter than 30 seconds.

Description of a simulation run of the logistics simulation for bridge traffic.

Scope of the overall simulation

-The supply of all stops on the entire modeled route network is simulated.

-Only one direction of travel is simulated, which is used by 50% of all existing vehicles.

-The aim of the simulation is to determine the performance of the system under maximum load.

-The simulation considers the worst case.

Stiftung Altes Neuland Frankfurt GNU

 Simulation result

The simulation result is obtained from three measured key figures:

1.Stop count: Number of vehicles that stop at a station of the network within 24 hrs.

2.Average speed: The speed at which vehicles travel on average.

3.Total time: The time required by the vehicles to travel to a sequence of stops.

Description of a simulation run of the logistics simulation: The algorithm for the route of the vehicles in the system works with fixed values

Generation of the vehicles

At the beginning of the side arms, vehicles are created with a time interval of 90 seconds from a so-called "source" (this "creates" vehicles that start anew in the route network).

The vehicles then stop at all stations on this side arm - this is the worst case: in reality, they only stop at stops for which demand has been reported to the central control system.

Operation of the entire route network

The vehicles drive along the ring road and other side arms according to the following system:

-The vehicles travel via the ring to all other side arms: All stations are served both on the ring and on the side arms. The distribution of how many vehicles call at which side arms is determined as follows:

-

-

-

-

-

-

-

-

-Not only are all side arms served, but also the ring is completely served with one line.

-Vehicles of the so-called "basic noise" travel the ring without stopping at stations.

-Since only one direction of travel was considered in the simulation, all vehicle counts were used halved.

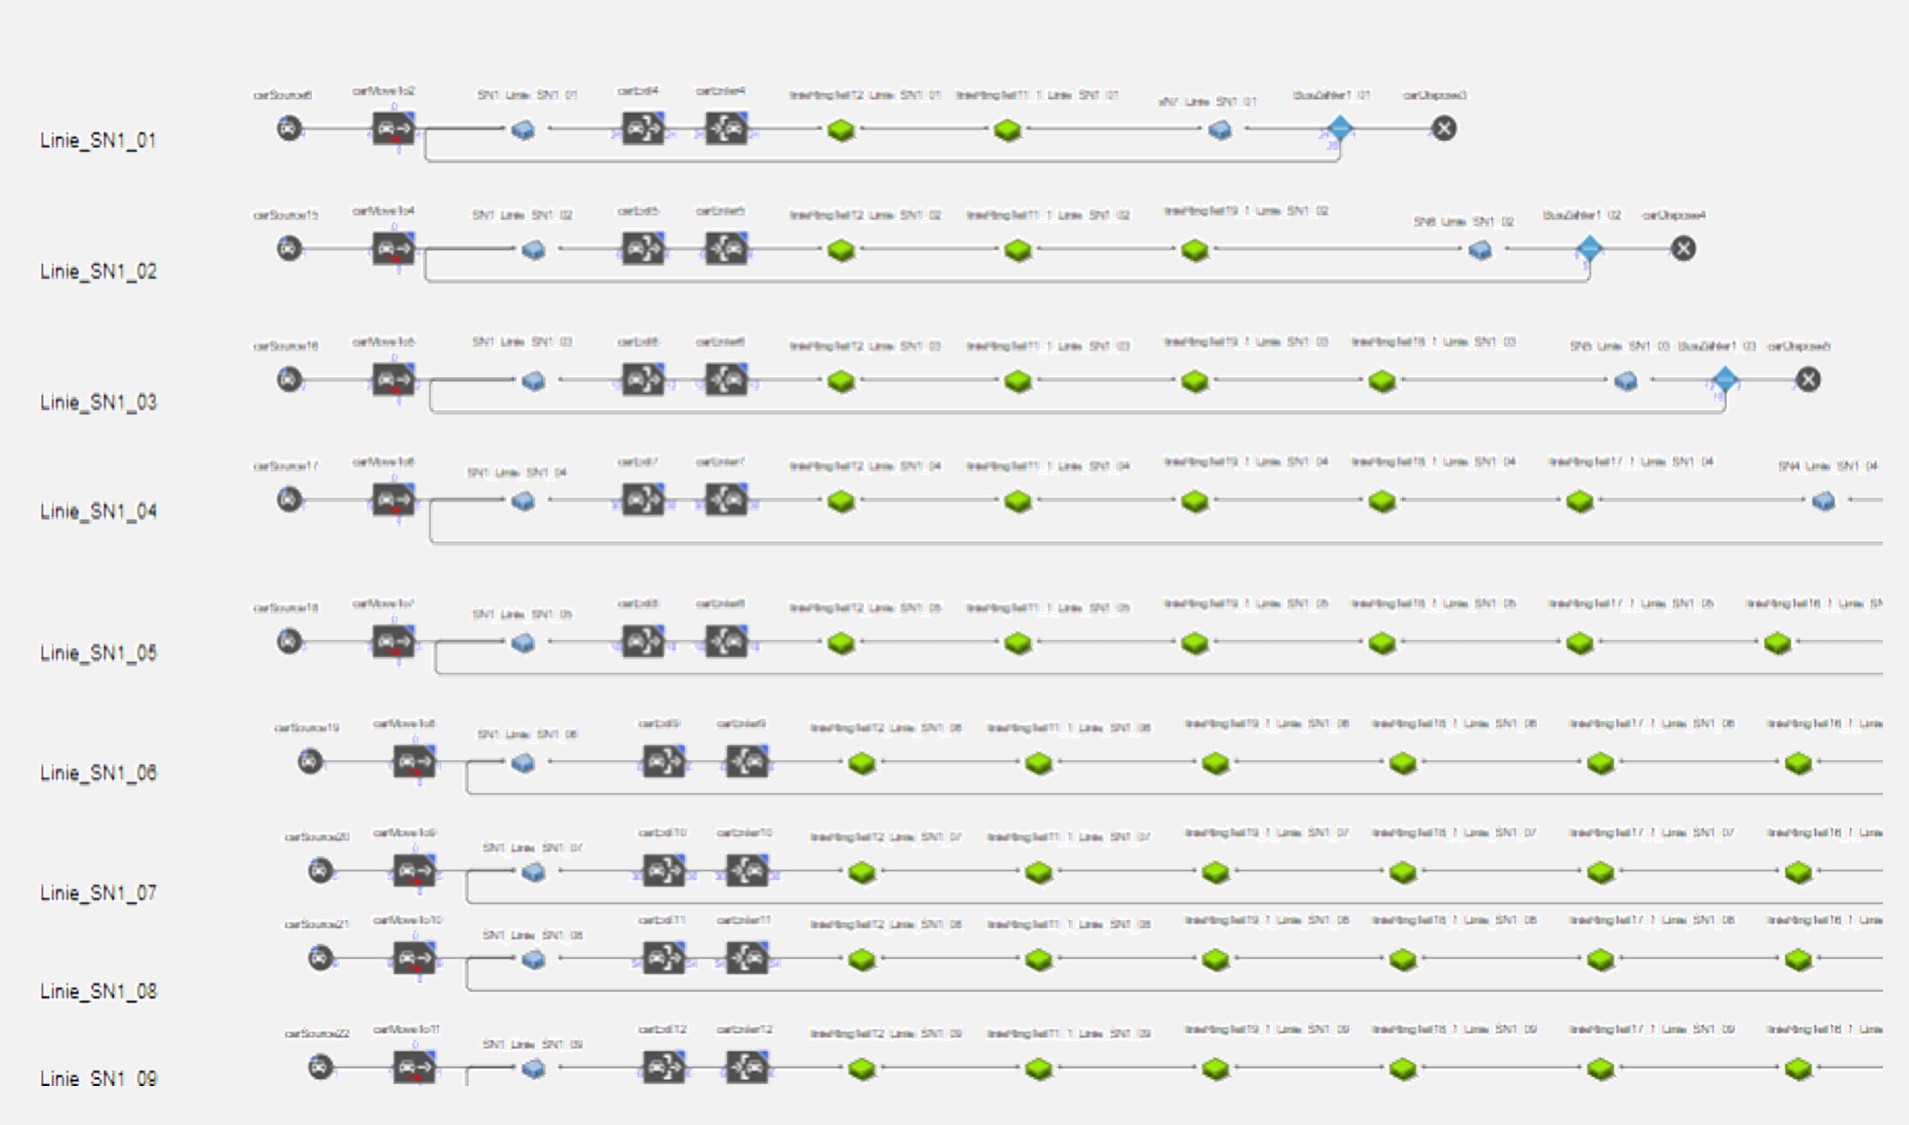
-A total of 74 lines from each branch serve all areas and stations of the route network.

-

Simulation run

Once all 400 vehicles have been brought into the system via the sources and distributed to the lines according to the key shown in the table, they repeat their route until the end of the simulation (predefined simulation time: 86,000s = 24h).

A logistics simulation run can be divided into three stages

Start of the simulation

From the start of each simulation run, vehicles are generated at the starting point of each side arm as well as at a point in the ring with a time interval of 90 seconds from a so-called source (this generates vehicles that start anew in the route network - see above).

Anyaberkut - depositphotos.com.

Course of the simulation

Once all vehicles have started into the route network (340 vehicles stopping at stations and 60 vehicles representing the background noise), they travel to all areas of the route network according to the distribution key described on the previous page.


When a vehicle reaches the end of its route, the vehicle repeatedly travels along this route. This ensures that the defined distribution key is adhered to throughout the simulation run - and that each route section is served continuously.

End of simulation

A simulation run for the traffic on the Frankfurt bridges ends after 86,400 s, which corresponds to a simulation time of 24 hours. At this point, the statistics are stored and evaluated.

Steve Mann - dreamstime.com

Each simulation run of the logistics simulation follows an algorithm that assumes certain routes of the vehicles

Simulation process - graphically explained

The vehicles start at the beginning of a side arm, then drive through all stations of this side arm and then distribute themselves according to the distribution key in the system.


I.e. there is a line that travels from the start side arm onto the ring and then into the nearest side arm (1), then a line that travels after the start arm into the side arm after the next (2) and one that travels along the third arm from the start side arm (3). Once a vehicle has completed the route, it travels along it again.


For clarity, the figure shows this as an example for one sidearm as well as only for the subsequent distribution into 3 sidearms/areas of the system.

In total, all other side arms and the ring are traveled from each side arm. Including background noise, this results in 74 lines.

The simulation result shows: Local bridge traffic provides a high-performance and reliable transportation promise, as simulated key figures show

To ensure that the performance promise is met even before the line is built, a wide variety of key performance indicators are used in the logistics simulation - which are measured during each simulation run:

Number of vehicles - Cycle time - Stops per vehicle - Stops per stop - Total travel time of a vehicle - Distance traveled by a vehicle, etc.

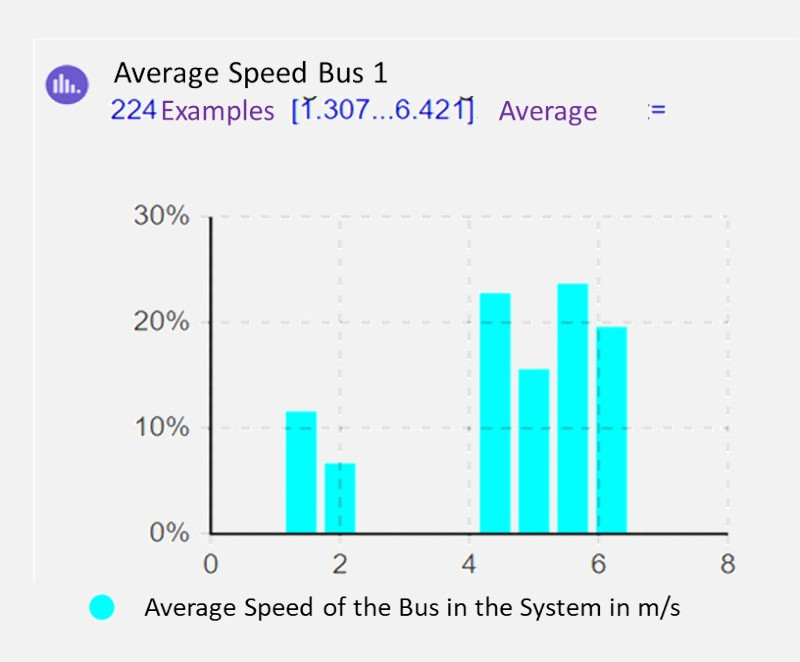
Vehicles on the bridges travel at an average speed of around 19 km/h

Deceleration and acceleration before and after stops were included in the average speed - the stopping time, however, was not included in this average value.


Away from the stop and station areas, vehicles travel at 30 km/h unless they brake at passenger crossings. However, these travel interruptions were not taken into account in the simulation, as they would have gone beyond the scope of the feasibility study.

Stiftung Altes Neuland Frankfurt / GNU

Speed affects passenger comfort: This was taken into account in the route planning, as were the short transport times

The speed at which a vehicle can negotiate a curve is determined by the geometry of the track and the specified limits for lateral acceleration. For traffic on the Frankfurt bridges, the lateral acceleration is set at a maximum of 1 m/s2 , which allows passengers to move safely in the vehicle during the journey and also to enjoy the ride while standing. This was taken into account in the route planning by means of large curve radii, allowing the vehicles to negotiate almost all curves at 30 km/h.

Stiftung Altes Neuland Frankfurt / GNU

The bridge traffic system (BVS) was divided into different sections

Result of the simulation: At least about 70,000 passengers can be transported daily with the larger vehicles on the bridges, in total at least 25 million per year - if the parameter "passenger change at stations" is increased from four to 6 to 7, at least about 40 million passengers can be transported annually.

The final result of the overall simulation can be output by sections of the traffic system and includes the following quantities:

-Number of stops per section in 24 h.

-Average cycle time per section over 24 h.

-Passengers transported per section in 24 h, assuming an average of 4 passenger changes per stop (e.g., 2 boardings and alightings each).

Stiftung Altes Neuland Frankfurt GNU

According to the simulation (in the worst case scenario), a total of 68,814 people are transported per day (25.1 million passengers per year).

The fastest cycle time is 50 seconds. The slowest cycle time is 295 seconds (4 minutes 55 seconds).

Route examples show that bridge vehicles along the ring connect many points faster than RMV - despite low average speed of around 19km/h

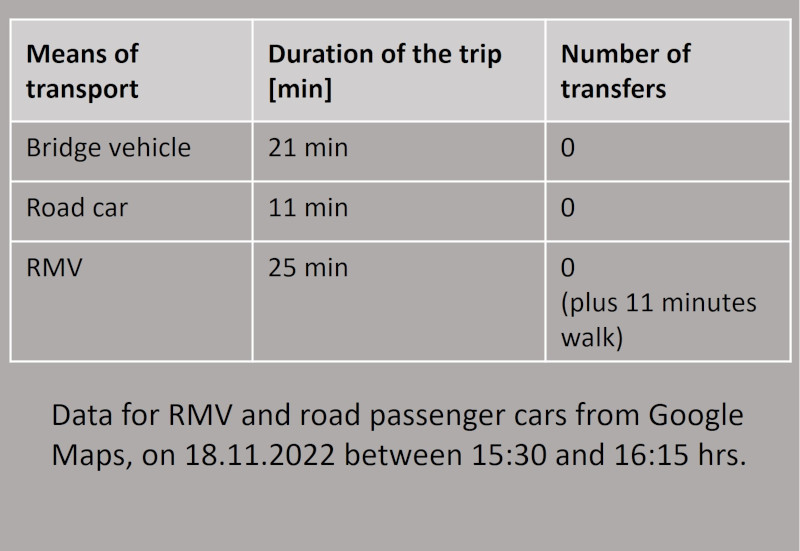
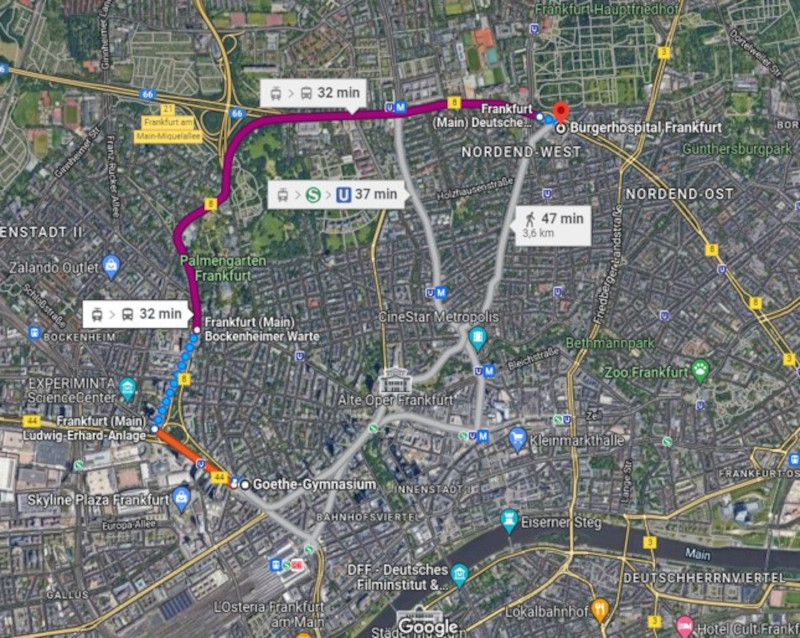
Example 1: With bridge transport, it takes 21 minutes to get from Bürgerhospital in Bornheim to the trade fair entrance near Emser Brücke - with RMV, on the other hand, it takes 25 minutes plus potential waiting time at the station of up to 15 minutes and a total walk of 11 minutes.

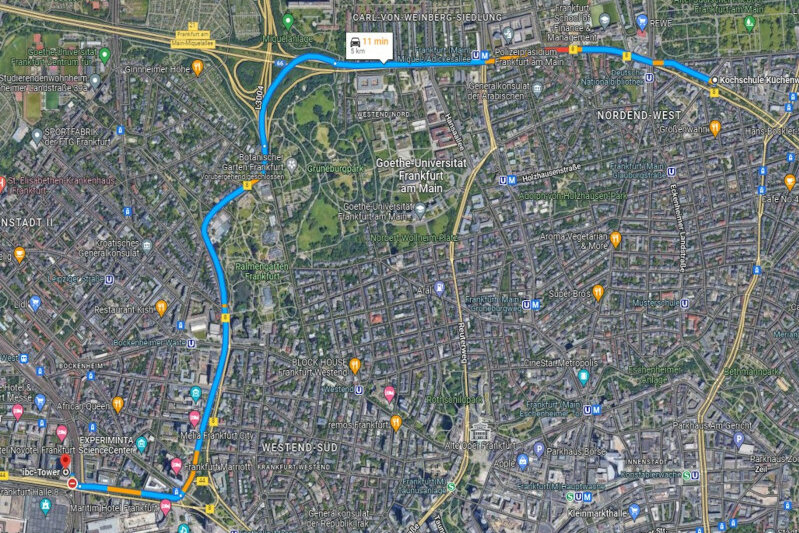
When the road is free and there is no traffic jam, cars on the road are of course the fastest - they can be surpassed by bridge traffic only by pleasant driving experience, high safety and convenience (you do not need to drive yourself and park your vehicle, refuel it, etc.).

Stiftung Altes Neuland Frankfurt GNU
Googe Earth

For many point-to-point connections along the bridge ring, public transport is only slightly slower, but its use requires changing trains, whereas with local bridge transport (BNV) one can comfortably drive through

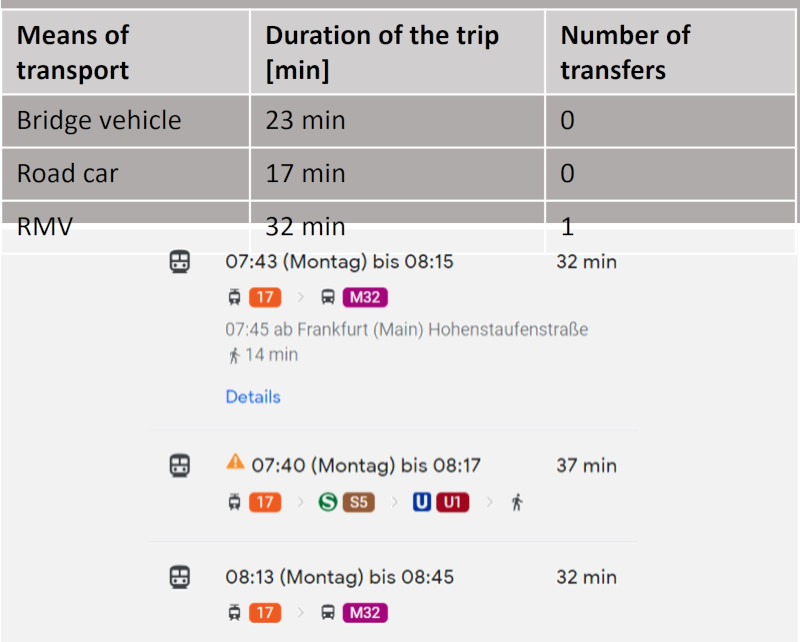
Addition to route example 1: in 23 min from Bürgerhospital to Goethe-Gymnasium. If you live in Bornheim today and want to send your child to the Goethe-Gymnasium at Friedrich-Ebert-Anlage, you have to put up with having to travel parts of the route twice above ground or once subway by S-Bahn or U-Bahn. With the BNV, on the other hand, all schools along the ring (about a dozen secondary schools and also numerous elementary schools) can be reached more easily for many Frankfurt residents who live on the other side of the city and often do not even consider these schools for their children because of more costly public transport connections. 

Stiftung Altes Neuland Frankfurt GNU
Google Earth

Leisure facilities in the city can also be reached much more easily and comfortably with the BNV: Both the facilities in the city center are easily accessible for residents on the outer arms of the bridges with the BNV, as well as facilities on the "other side" of the city.

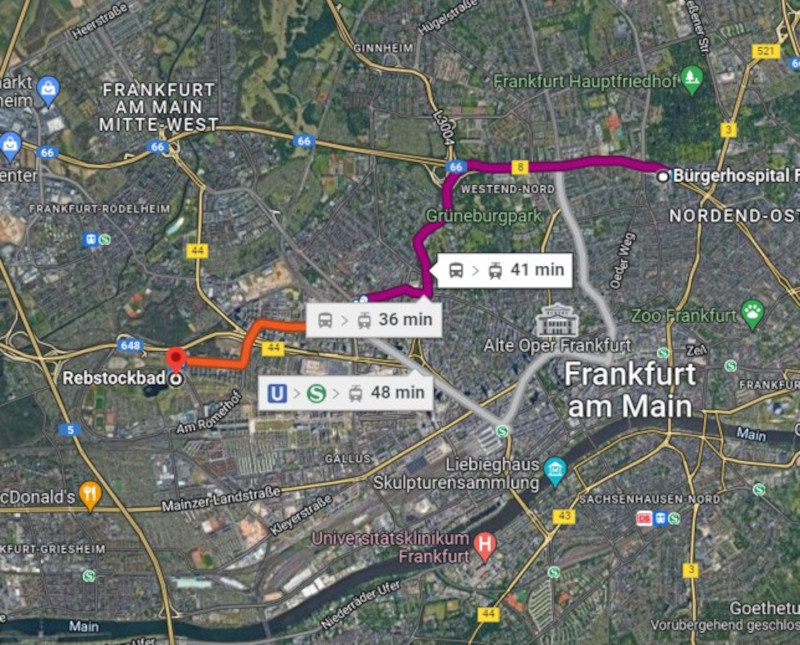
Route example 2: From Bornheim to Rebstockbad in 33 minutes without changing trains - by public transport, the journey takes the same amount of time, but you have to change trains at least once. If you travel even further from the east to Rebstockbad, e.g. from Helmholtzschule, the journey time by public transport increases to 42 minutes, or you have to change to the subway once for a faster connection - local bridge transport, on the other hand, takes only a few minutes more and runs "door to door" over days.

Stiftung Altes Neuland Frankfurt GNU
Google Earth

You can get from one outer arm of the Frankfurt bridges to the other outer arm by BNV in almost half the time as by public transport - and even the journey on the roads by car is no longer significantly faster on these routes

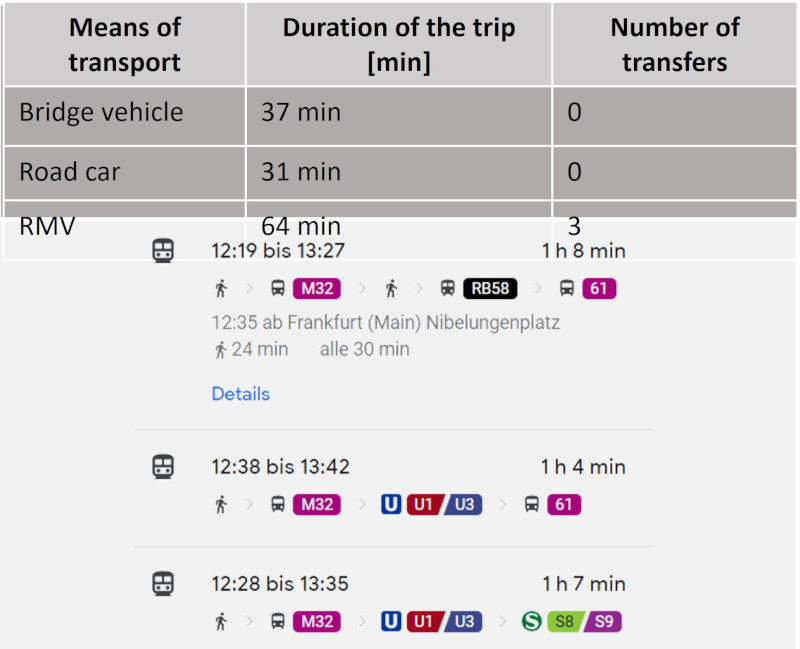
Route example 3: From Bornheim to Deutsche Bank Park (formerly Commerzbank Arena) takes only 37 minutes by BNV, but more than an hour by public transport - with three changes and (in the case of the fastest connection) with a partial journey in the subway - which is less pleasant for children, women or elderly people than using transport "above ground", especially in the evening and night hours. 

Stiftung Altes Neuland Frankfurt GNU
Google Earth

There are also routes on which local bridge transport is significantly slower than public transport - but still with the advantage that even unusual connections can be covered without changing trains

Example 4: If you want to get from Fechenheim to the Carl-von-Weinberg-Siedlung at Miquelallee, you can do it by public transport in three quarters of an hour, while the local public transport takes (worst case) more than an hour - assuming, as in the simulation, that the vehicle stops at almost all stations along the way. However, if we assume that in reality there will also be trips with few station stops, the trip duration of the BNV comes close to that of the ÖPNV.


The respective situations or circumstances on the route also change the results of a speed comparison for passenger cars on the road: In the event of a traffic jam on Hanauer Landstraße, for example, the trip from Fechenheim to Miquelallee by passenger car on some days can also lead to completely different values than the average of 20 to 40 minutes mentioned here.

Stiftung Altes Neuland Frankfurt GNU
Google Earth

The fastest traffic route through Frankfurt on average are the bridges

As the table below shows, the bridge network is one of the fastest ways to get around the Frankfurt metropolitan area. Particularly in comparison to the existing RMV public transport services, the vehicles on the bridges are an attractive alternative to reach the respective desired destination - a relief for road traffic as well as for public transport.

Stiftung Altes Neuland Frankfurt GNU

The present simulation has considerable optimization potential because it assumes the worst case of the load on the overall system: For real operation, a significantly better performance of the traffic system can be expected in the "normal case" - which means that significantly more than 25 million passengers p.a. can be transported.

The present overall simulation simulates the extreme case / worst case of the load on the overall system. In real operation, there is a "normal operation" compared to this worst-case load, with a significantly higher performance of the traffic system:

1.In real operation, stations are approached on demand (passenger requests ride via app or camera reports that someone is waiting at the station, who may have entered their destination on a screen there) - i.e. unlike in the worst-case load simulation, stops are no longer made at every station, but only where people are also boarding or alighting.

àReduction of the time required for the distance traveled, since deceleration, 30 s stopping time and acceleration at all skipped stations are eliminated.


2.Areas where there is no or low demand can also be served less frequently or only on request, because passengers can book rides as needed via app (even in advance or already on the way to the stop). This creates capacity for areas with high utilization.

  à Reduction of the cycle time in rush hour traffic

  à Increase in the maximum number of passengers that can be transported in rush-hour traffic.


3. if necessary, the number of vehicles can be increased to some extent (by postponing routine maintenance stops at the bridge ends) to reduce cycle times and increase the number of people carried.

  à Reduction of the cycle time of all sections

  à Increase in the maximum number of people that can be transported in all sections.

No congestion due to route optimization and on-demand system

Stiftung Altes Neuland Frankfurt / GNU

Centrally controlled autonomous driving traffic systems are the future: In a few decades, they will be established in conurbations worldwide - with the Frankfurt bridges, Europe has the chance to become a pioneer in all the technologies needed for this purpose

Europe may have a strong automotive industry, but the prerequisites for the introduction of centrally controlled autonomous driving traffic systems are - especially legally - significantly better in other countries such as China or the USA, or the hurdles are lower and the pressure of suffering is also often higher.


This makes it all the more important to create an innovation platform in Europe where the operation and optimization of autonomous driving traffic can be tested and all the technologies and AI systems required for this can be applied. Only by means of a large live simulation can problems be eliminated, challenges overcome and learning curves run through.


Due to its size, traffic infrastructure and commuter history, Frankfurt offers the ideal location to not only create a research area for the automotive industry with the live platform Frankfurt Bridges, but also to actually significantly improve its own traffic situation: For cars and trucks on the roads, the Frankfurt bridges mean massive relief from congestion incidents, for cyclists it creates more space to introduce bike lanes, and for public transport users it results in significantly better point-to-point connections across the city for very many routes:


-You can reach countless distant destinations without changing trains

-You can often reach them much faster than by public transport

-You have comparatively short waiting times of 50 seconds to a maximum of 5 minutes

-The complete transport takes place above ground and is a safer and more pleasant alternative for children, women or elderly people than the underground or suburban train stations, especially in the evening and night hours.

The BNV is planned as a self-learning system: such a system will become better and more effective over time

The computer system that controls the vehicles learns from the incoming data: If there is always high demand at a certain stop at a certain time, this will be scheduled in advance in the future.

Major events such as soccer matches or concerts are also noted in advance. The system then calculates the demand for vehicles and deploys more vehicles at these times.

Laurent_T_-_shutterstock.com

For commuter traffic into Frankfurt, there are optimal park-and-ride options at two locations: At the Deutsche Bank Park parking lot (stadium) and at the trade fair parking lot at Römerhof, convenient transfer options from the car to the local bridge transport system can be planned

There are no comparably large parking lots on the other arms of the bridge - but in isolated cases, smaller park-and-ride interchanges can be created there as well, which can relieve downtown traffic.

Google Earth

Autonomous driving bridge traffic can massively relieve Frankfurt's traffic and at the same time represents a technology platform for Europe's automotive industry

The local bridge traffic system (BNV) can transport around 40 million passengers per year.

This will create many connections for Frankfurt citizens for which there was previously a public transport service, but which often work faster, without changing trains and above ground (i.e. not with subway trains) with the bridge service.

There is no comparable network of an autonomously driving system in the world, because currently everywhere too many road users still use the same lane as the autonomously driving vehicles: With the BNV, a network of protected lanes is being created on which autonomously driving traffic can be established and researched for the first time at this complexity and scale.